Appearance
教程
这是使用 Mermaid.JS 的公开教程列表,旨在作为使用在线编辑器生成图表以及通过 HTML 部署 Mermaid.JS 的基本介绍。
英This is a list of publicly available Tutorials for using Mermaid.JS and is intended as a basic introduction for the use of the Live Editor for generating diagrams, and deploying Mermaid.JS through HTML.
请注意,这些教程可能会显示较旧的界面,但在线编辑器的用法大致相同。
英Note that these tutorials might display an older interface, but the usage of the live-editor will largely be the same.
对于大多数用途,你可以使用 在线编辑器 来快速轻松地渲染图表。
英For most purposes, you can use the Live Editor, to quickly and easily render a diagram.
在线编辑器教程
从版本 8.7.0 开始,在线编辑器可以生成的定义也向后兼容。
英The definitions that can be generated the Live-Editor are also backwards-compatible as of version 8.7.0.
Chris Chinchilla:动手实践 - 基于文本的 Mermaid 图表
英Chris Chinchilla: Hands on - Text-based diagrams with Mermaid
GitLab Unfiltered:如何创建 Mermaid 图
英GitLab Unfiltered: How to Create Mermaid Diagrams
GitLab Unfiltered:Emilie 在手册中添加了 Mermaid 图
英GitLab Unfiltered: Emilie adds a mermaid diagram to the handbook
零的世界:我学习如何在 Mermaid.JS 中构建流程图和信号图
英World of Zero: I Learn How To Build Flowcharts and Signal Diagram's in Mermaid.JS
英Eddie Jaoude: Can you code your diagrams?
Mermaid 与 OpenAI
Elle Neal:人工智能思维导图:神经多样化学习者的一种易于使用的方法教程:、演示:
英Elle Neal: Mind Mapping with AI: An Accessible Approach for Neurodiverse Learners Tutorial:, Demo:
Mermaid 与 HTML
入门 中提供了示例
英Examples are provided in Getting Started
代码笔示例:
英CodePen Examples:
https://codepen.io/CarlBoneri/pen/BQwZzq
英https://codepen.io/CarlBoneri/pen/BQwZzq
https://codepen.io/tdkn/pen/vZxQzd
英https://codepen.io/tdkn/pen/vZxQzd
https://codepen.io/janzeteachesit/pen/OWWZKN
英https://codepen.io/janzeteachesit/pen/OWWZKN
带文本区域的 Mermaid
https://codepen.io/Ryuno-Ki/pen/LNxwgR
英https://codepen.io/Ryuno-Ki/pen/LNxwgR
开源文档中的 Mermaid
K8s.dev 博客:使用 Mermaid.js 图表改进你的文档
英K8s.dev blog: Improve your documentation with Mermaid.js diagrams
Jupyter 与 mermaid-js 集成
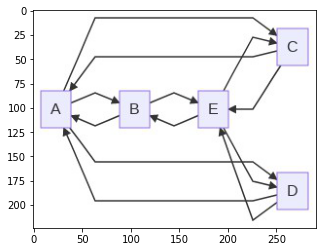
以下是 Python 与 mermaid-js 集成的示例,该示例使用 mermaid.ink 服务,在 Jupyter 注意本中显示图形。
英Here's an example of Python integration with mermaid-js which uses the mermaid.ink service, that displays the graph in a Jupyter notebook.
python
import base64
from IPython.display import Image, display
import matplotlib.pyplot as plt

def mm(graph):
    graphbytes = graph.encode("utf8")
    base64_bytes = base64.b64encode(graphbytes)
    base64_string = base64_bytes.decode("ascii")
    display(Image(url="https://mermaid.ink/img/" + base64_string))

mm("""
graph LR;
    A--> B & C & D;
    B--> A & E;
    C--> A & E;
    D--> A & E;
    E--> B & C & D;
""")
输出
英Output