主题
教程
🌐 Tutorials
这是一个公开可用的 Mermaid.JS 教程列表,旨在作为使用实时编辑器生成图表以及通过 HTML 部署 Mermaid.JS 的基础入门介绍。
🌐 This is a list of publicly available Tutorials for using Mermaid.JS and is intended as a basic introduction for the use of the Live Editor for generating diagrams, and deploying Mermaid.JS through HTML.
请注意,这些教程可能显示的是较旧的界面,但实时编辑器的使用方法基本相同。
在大多数情况下,你可以使用 Live Editor 来快速轻松地渲染图表。
🌐 For most purposes, you can use the Live Editor, to quickly and easily render a diagram.
实时编辑器教程
🌐 Live-Editor Tutorials
从版本 8.7.0 开始,通过实时编辑器生成的定义也向后兼容。
🌐 The definitions that can be generated the Live-Editor are also backwards-compatible as of version 8.7.0.
Chris Chinchilla:实操 - 使用 Mermaid 创建基于文本的图表
GitLab 无过滤:Emilie 向手册添加了一个 Mermaid 图表
零世界:我学习如何使用 Mermaid.JS 制作流程图和信号图
与 OpenAI 的 Mermaid
🌐 Mermaid with OpenAI
Elle Neal: 使用人工智能进行思维导图:针对神经多样化学习者的可访问方法教程:
使用 HTML 的 Mermaid
🌐 Mermaid with HTML
示例在 入门指南 中提供
🌐 Examples are provided in Getting Started
CodePen 示例:
https://codepen.io/CarlBoneri/pen/BQwZzq
https://codepen.io/tdkn/pen/vZxQzd
https://codepen.io/janzeteachesit/pen/OWWZKN
带文本区域的 Mermaid
🌐 Mermaid with Text Area
https://codepen.io/Ryuno-Ki/pen/LNxwgR
开源文档中的 Mermaid
🌐 Mermaid in open source docs
K8s.dev 博客:使用 Mermaid.js 图表改进你的文档
Jupyter / Python 与 mermaid-js 的集成
🌐 Jupyter / Python Integration with mermaid-js
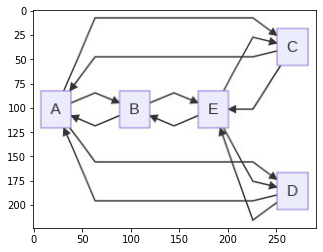
这是一个 Python 与 mermaid-js 集成的示例,它使用 mermaid.ink 服务,在 Jupyter 注意本中显示图表,并将其保存为指定分辨率的 .png 图片(在此示例中,dpi=1200)。
🌐 Here's an example of Python integration with mermaid-js which uses the mermaid.ink service, that displays the graph in a Jupyter notebook and save it as .png image with the stated resolution (in this example, dpi=1200).
python
import base64
import io, requests
from IPython.display import Image, display
from PIL import Image as im
import matplotlib.pyplot as plt

def mm(graph):
    graphbytes = graph.encode("utf8")
    base64_bytes = base64.urlsafe_b64encode(graphbytes)
    base64_string = base64_bytes.decode("ascii")
    img = im.open(io.BytesIO(requests.get('https://mermaid.ink/img/' + base64_string).content))
    plt.imshow(img)
    plt.axis('off') # allow to hide axis
    plt.savefig('image.png', dpi=1200)

mm("""
graph LR;
    A--> B & C & D
    B--> A & E
    C--> A & E
    D--> A & E
    E--> B & C & D
""")
输出