
主题
甘特图
🌐 Gantt diagrams
甘特图是一种柱状图,最早由卡罗尔·亚当耶茨基(Karol Adamiecki)于 1896 年开发,随后在 1910 年代由亨利·甘特(Henry Gantt)独立开发,用于展示项目进度以及完成某个项目所需的时间。甘特图显示了项目终端元素和汇总元素的起始日期与完成日期之间的天数。
给用户的说明
🌐 A note to users
甘特图会将每个计划任务记录为一条从左到右延伸的连续条。x 轴表示时间,y 轴记录不同的任务及其完成顺序。
🌐 Gantt Charts will record each scheduled task as one continuous bar that extends from the left to the right. The x axis represents time and the y records the different tasks and the order in which they are to be completed.
重要的是要记住,当某个任务的日期、天数或特定日期集合被“排除”时,甘特图会通过在右侧延长相同天数来适应这些更改,而不是在任务内部创建间隙。
如图所示 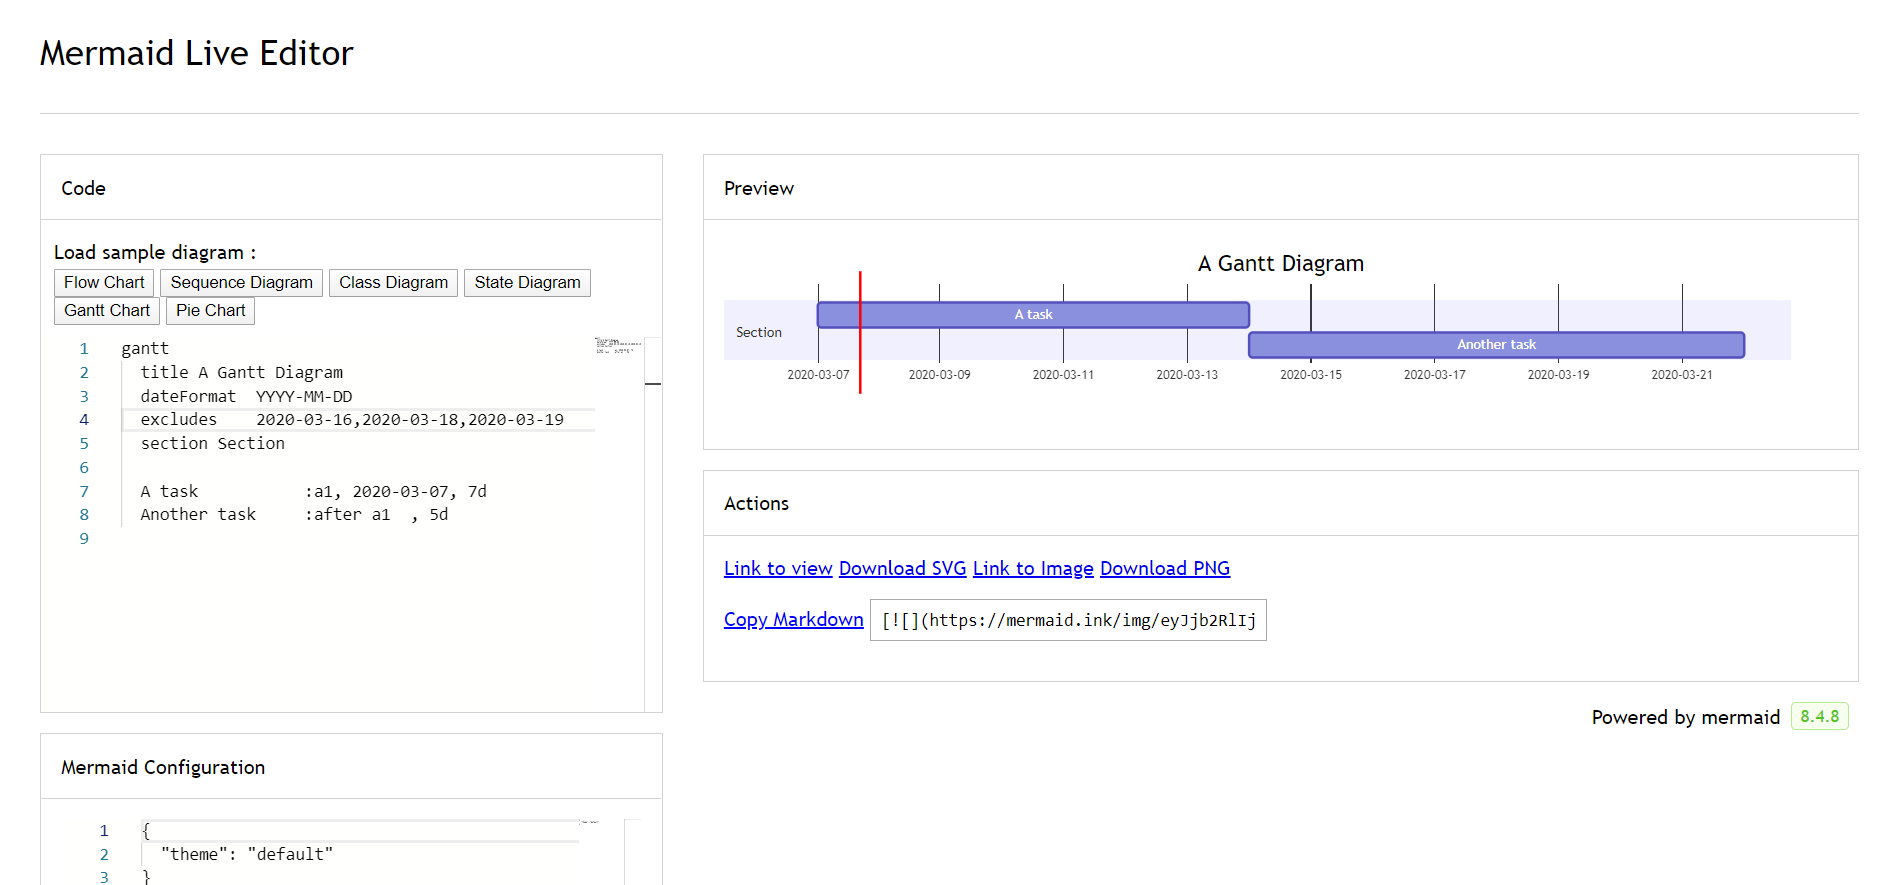
🌐 It is important to remember that when a date, day, or collection of dates specific to a task are "excluded", the Gantt Chart will accommodate those changes by extending an equal number of days, towards the right, not by creating a gap inside the task. As shown here
但是,如果排除的日期位于两个连续开始的任务之间,排除的日期将在图表上被跳过并留空,随后任务将在排除日期结束后开始。如图所示 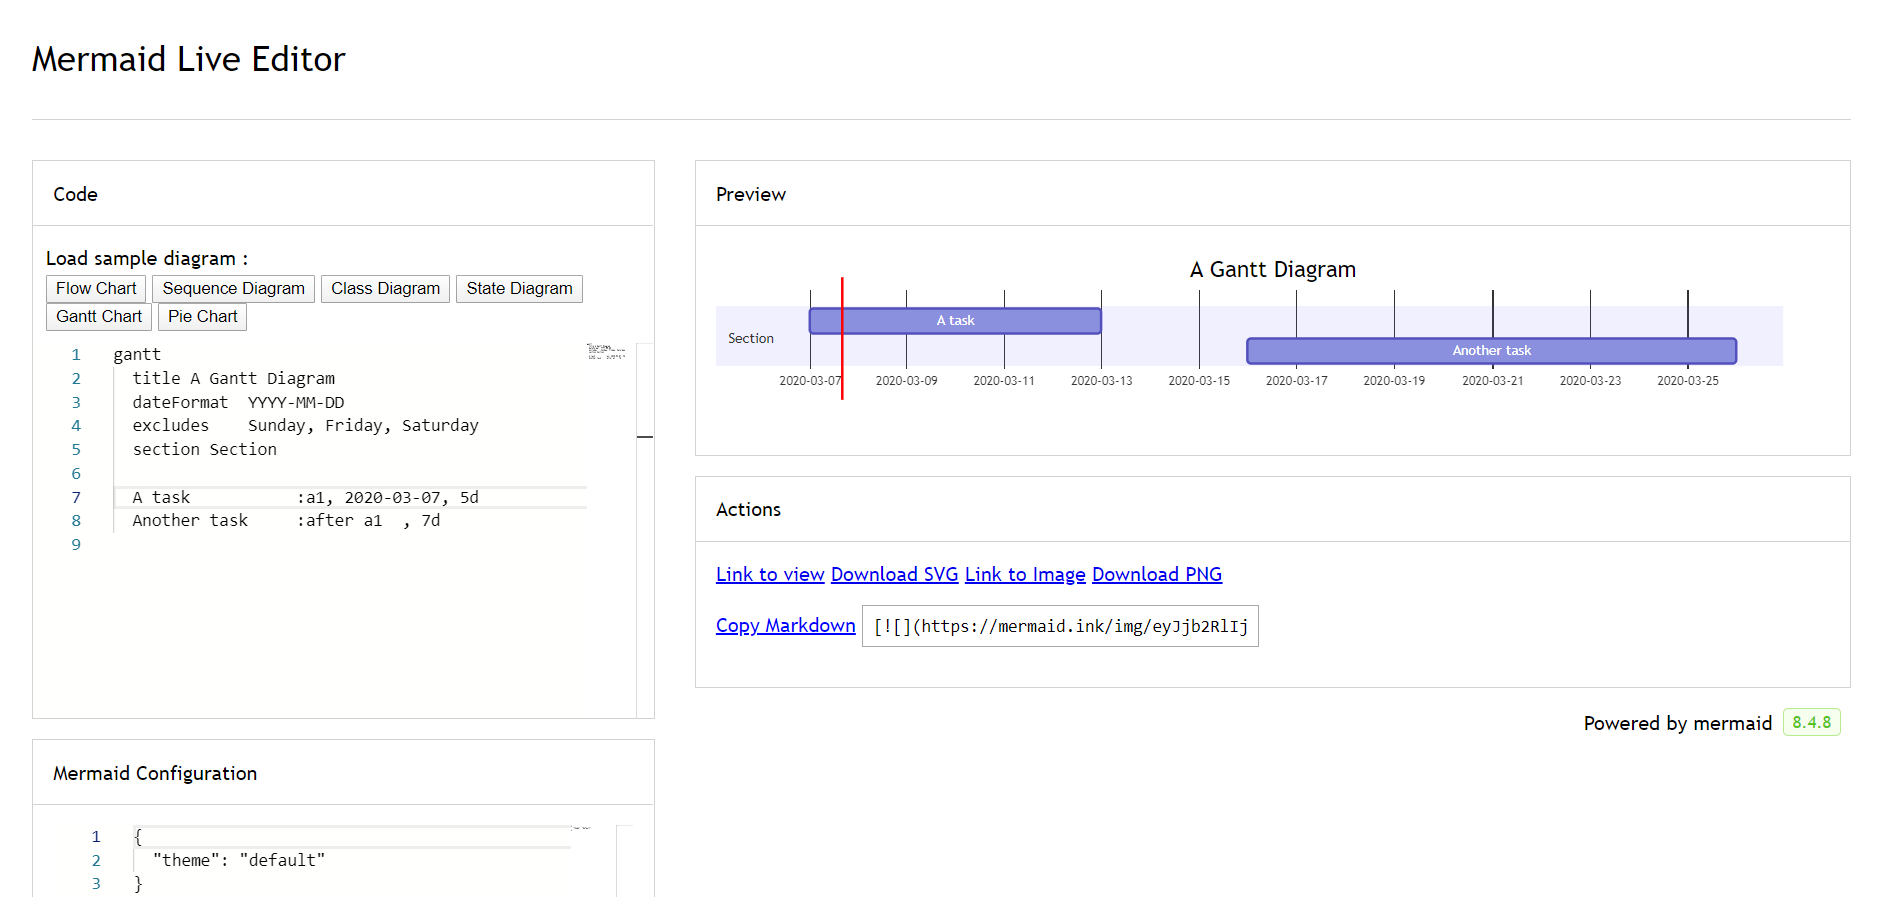
🌐 However, if the excluded dates are between two tasks that are set to start consecutively, the excluded dates will be skipped graphically and left blank, and the following task will begin after the end of the excluded dates. As shown here
甘特图对于追踪项目完成所需的时间非常有用,但通过一些调整,它也可以用于图形化地表示“非工作日”。
🌐 A Gantt chart is useful for tracking the amount of time it would take before a project is finished, but it can also be used to graphically represent "non-working days", with a few tweaks.
Mermaid 可以将甘特图渲染为 SVG、PNG 或可粘贴到文档中的 Markdown 链接。
🌐 Mermaid can render Gantt diagrams as SVG, PNG or a MarkDown link that can be pasted into docs.
代码:
mermaid
语法
🌐 Syntax
代码:
mermaid
任务默认是顺序进行的。任务的开始日期默认为前一个任务的结束日期。
🌐 Tasks are by default sequential. A task start date defaults to the end date of the preceding task.
冒号 : 用于分隔任务标题和其元数据。元数据项之间用逗号 , 分隔。有效标签包括 active、done、crit 和 milestone。标签是可选的,但如果使用,必须放在最前面。处理完标签后,剩余的元数据项解释如下:
🌐 A colon, :, separates the task title from its metadata. Metadata items are separated by a comma, ,. Valid tags are active, done, crit, and milestone. Tags are optional, but if used, they must be specified first. After processing the tags, the remaining metadata items are interpreted as follows:
- 如果指定了单个项目,它将决定任务的结束时间。它可以是具体的日期/时间,也可以是持续时间。如果指定了持续时间,则会将其加到任务的开始日期上,以确定任务的结束日期,同时考虑任何排除的情况。
- 如果指定了两个项目,则最后一个项目的解释方式与前一种情况相同。第一个项目可以指定一个明确的开始日期/时间(格式由
dateFormat指定),也可以通过after <otherTaskID> [[otherTaskID2 [otherTaskID3]]...]引用另一个任务。在后一种情况下,任务的开始日期将根据任何被引用任务的最近结束日期来设置。 - 如果指定了三个项目,最后两个将按前面的情况解释。第一个项目将表示任务的 ID,可以使用
later <taskID>语法引用它。
| 元数据语法 | 开始日期 | 结束日期 | ID |
|---|---|---|---|
<taskID>, <startDate>, <endDate> | 使用 dateformat 解释的 startdate | 使用 dateformat 解释的 endDate | taskID |
<taskID>, <startDate>, <length> | 使用 dateformat 解释的 startdate | 开始日期 + length | taskID |
<taskID>, after <otherTaskId>, <endDate> | 先前指定任务 otherTaskID 的结束日期 | 使用 dateformat 解释的 endDate | taskID |
<taskID>, after <otherTaskId>, <length> | 先前指定任务 otherTaskID 的结束日期 | 开始日期 + length | taskID |
<taskID>, <startDate>, until <otherTaskId> | 使用 dateformat 解释的 startdate | 先前指定任务 otherTaskID 的开始日期 | taskID |
<taskID>, after <otherTaskId>, until <otherTaskId> | 先前指定任务 otherTaskID 的结束日期 | 先前指定任务 otherTaskID 的开始日期 | taskID |
<startDate>, <endDate> | 使用 dateformat 解释的 startdate | 使用 dateformat 解释的 enddate | 不适用 |
<startDate>, <length> | 使用 dateformat 解释的 startdate | 开始日期 + length | 不适用 |
after <otherTaskID>, <endDate> | 先前指定任务 otherTaskID 的结束日期 | 使用 dateformat 解释的 enddate | 不适用 |
after <otherTaskID>, <length> | 先前指定任务 otherTaskID 的结束日期 | 开始日期 + length | 不适用 |
<startDate>, until <otherTaskId> | 使用 dateformat 解释的 startdate | 先前指定任务 otherTaskID 的开始日期 | 不适用 |
after <otherTaskId>, until <otherTaskId> | 先前指定任务 otherTaskID 的结束日期 | 先前指定任务 otherTaskID 的开始日期 | 不适用 |
<endDate> | 前一任务的结束日期 | 使用 dateformat 解释的 enddate | 不适用 |
<length> | 前一个任务的结束日期 | 开始日期 + length | 不适用 |
until <otherTaskId> | 前一个任务的结束日期 | 之前指定任务 otherTaskID 的开始日期 | 不适用 |
信息
在 (v10.9.0+) 中添加了对关键字 until 的支持。这可以用于定义一个任务,该任务会一直运行,直到某个特定的任务或里程碑开始。
持续时间格式
🌐 Duration format
在指定 <length> 时,使用一个数字,后跟以下单位后缀之一:
🌐 When specifying a <length>, use a number followed by one of these unit suffixes:
| 单位 | 后缀 | 示例 |
|---|---|---|
| 毫秒 | ms | 500ms |
| 秒 | s | 30s |
| 分钟 | m | 30m |
| 小时 | h | 4h |
| 天 | d | 3d |
| 周 | w | 2w |
| 月 | M | 1M |
| 年 | y | 1y |
也支持十进制值(例如,1.5d)。无效的持续时间标记(例如,3dX)将被忽略,任务将默认持续时间为零。
🌐 Decimal values are also supported (e.g., 1.5d). Invalid duration tokens (e.g., 3dX) will be ignored and the task will default to zero duration.
为简便起见,表中未显示使用 after 关键字列出的多个任务。以下是如何使用它及其解释的示例:
🌐 For simplicity, the table does not show the use of multiple tasks listed with the after keyword. Here is an example of how to use it and how it's interpreted:
代码:
mermaid
标题
🌐 Title
title 是一个可选字符串,用于显示在甘特图顶部,以概述整个图表。
🌐 The title is an optional string to be displayed at the top of the Gantt chart to describe the chart as a whole.
不包括
🌐 Excludes
excludes 是一个 可选 属性,接受特定日期(YYYY-MM-DD 格式)、星期几(例如 "sunday")或 "weekends",但不能使用 "weekdays" 这个词。 这些日期将在图表上标记,并从任务的持续时间计算中排除。这意味着,如果任务期间包含被排除的日期,'跳过' 的天数将会加到任务结束时间,以确保任务的持续时间与代码中指定的一致。
🌐 The excludes is an optional attribute that accepts specific dates in YYYY-MM-DD format, days of the week ("sunday") or "weekends", but not the word "weekdays". These date will be marked on the graph, and be excluded from the duration calculation of tasks. Meaning that if there are excluded dates during a task interval, the number of 'skipped' days will be added to the end of the task to ensure the duration is as specified in the code.
支持多条 excludes 行,并且它们的令牌会被连接,因此可以将较长的排除列表拆分到带有注释的分组行中:
🌐 Multiple excludes lines are supported and their tokens are concatenated, so long exclusion lists can be split across grouped lines with comments:
gantt
    dateFormat DD-MM-YYYY
    excludes weekends
    %% week 7 is winter break
    excludes 10-02-2025 11-02-2025 12-02-2025 13-02-2025 14-02-2025
    %% workers holiday 1 maj
    excludes 01-05-2025
周末 (v\11.0.0+)
🌐 Weekend (v\11.0.0+)
在排除周末的情况下,可以将周末设置为周五和周六,或周六和周日。默认情况下,周末是周六和周日。 要定义周末的开始日,可以在新行中添加一个可选属性 weekend,后面跟 friday 或 saturday。
🌐 When excluding weekends, it is possible to configure the weekends to be either Friday and Saturday or Saturday and Sunday. By default weekends are Saturday and Sunday. To define the weekend start day, there is an optional attribute weekend that can be added in a new line followed by either friday or saturday.
代码:
mermaid
部分声明
🌐 Section statements
你可以将图表划分为不同的部分,例如将项目的不同部分如开发和文档分开。
🌐 You can divide the chart into various sections, for example to separate different parts of a project like development and documentation.
为此,请在一行开头使用 section 关键字并为其命名。(请注意,与整个图表的标题不同,这个名称是 _ 必需的 _。)
🌐 To do so, start a line with the section keyword and give it a name. (Note that unlike with the title for the entire chart, this name is required.
里程碑
🌐 Milestones
你可以向图表中添加里程碑。里程碑不同于任务,因为它们表示一个具体的时间点,并且用关键字 milestone 来标识。以下是如何使用里程碑的示例。你可能会注意到,里程碑的确切位置由里程碑的起始日期和任务的“持续时间”决定,计算方式如下:_ 起始日期 + 持续时间 _/2。
🌐 You can add milestones to the diagrams. Milestones differ from tasks as they represent a single instant in time and are identified by the keyword milestone. Below is an example on how to use milestones. As you may notice, the exact location of the milestone is determined by the initial date for the milestone and the "duration" of the task this way: initial date+duration/2.
代码:
mermaid
垂直标记
🌐 Vertical Markers
vert 关键字让你可以在甘特图中添加垂直线,从而轻松高亮重要日期,比如截止日期、事件或检查点。这些标记会延伸到整个图表,并根据你提供的日期进行定位。与里程碑不同,垂直标记不会占用行。它们纯粹是视觉参考点,有助于分解时间线,使关键时刻更容易被发现。
🌐 The vert keyword lets you add vertical lines to your Gantt chart, making it easy to highlight important dates like deadlines, events, or checkpoints. These markers extend across the entire chart and are positioned based on the date you provide. Unlike milestones, vertical markers don’t take up a row. They’re purely visual reference points that help break up the timeline and make important moments easier to spot.
代码:
mermaid
设置日期
🌐 Setting dates
dateFormat 定义了甘特图元素的日期 输入 格式。渲染图表时这些日期的显示 输出 格式由 axisFormat 定义。
输入日期格式
🌐 Input date format
默认输入日期格式为 YYYY-MM-DD。你可以自定义 dateFormat。
🌐 The default input date format is YYYY-MM-DD. You can define your custom dateFormat.
markdown
dateFormat YYYY-MM-DD支持以下格式选项:
🌐 The following formatting options are supported:
| 输入 | 示例 | 描述 |
|---|---|---|
YYYY | 2014 | 四位年份 |
YY | 14 | 两位年份 |
Q | 1..4 | 年的季度。设置月份为该季度的第一个月 |
M MM | 1..12 | 月份数字 |
MMM MMMM | 一月..十二月 | 按 dayjs.locale() 设置的区域显示的月份名称 |
D DD | 1..31 | 月中的天数 |
Do | 1st..31st | 带序数的月日 |
DDD DDDD | 1..365 | 年中的天数 |
X | 1410715640.579 | Unix 时间戳 |
x | 1410715640579 | Unix 毫秒时间戳 |
H HH | 0..23 | 24 小时时间 |
h hh | 1..12 | 12 小时时间,与 a A 配合使用 |
a A | am pm | 上午或下午 |
m mm | 0..59 | 分钟 |
s ss | 0..59 | 秒 |
S | 0..9 | 秒的小数位(十分之一) |
SS | 0..99 | 秒的百分位(百分之一) |
SSS | 0..999 | 秒的千分位(千分之一) |
Z ZZ | +12:00 | 相对于 UTC 的偏移,格式为 +-HH:mm、+-HHmm 或 Z |
更多信息请参见: https://day.nodejs.cn/docs/en/parse/string-format/
🌐 More info in: https://day.nodejs.cn/docs/en/parse/string-format/
坐标轴上的输出日期格式
🌐 Output date format on the axis
默认的输出日期格式是 YYYY-MM-DD。你可以定义自定义的 axisFormat,例如 2020-Q1 表示 2020 年的第一季度。
🌐 The default output date format is YYYY-MM-DD. You can define your custom axisFormat, like 2020-Q1 for the first quarter of the year 2020.
markdown
axisFormat %Y-%m-%d支持以下格式化字符串:
🌐 The following formatting strings are supported:
| 格式 | 定义 |
|---|---|
| %a | 缩写的星期名称 |
| %A | 完整的星期名称 |
| %b | 缩写的月份名称 |
| %B | 完整月份名称 |
| %c | 日期和时间,格式为 "%a %b %e %H:%M:%S %Y" |
| %d | 以零填充的月份中的日期,作为十进制数字 [01,31] |
| %e | 月中的日期,以十进制数字表示并用空格填充 [1,31];等同于 %_d |
| %H | 小时(24小时制),十进制数字 [00,23] |
| %I | 小时(12小时制),十进制数字 [01,12] |
| %j | 以十进制数字表示的年份中的第几天 [001,366] |
| %m | 以小数形式表示的月份 [01,12] |
| %M | 分钟的小数形式 [00,59] |
| %L | 毫秒,作为十进制数 [000, 999] |
| %p | 上午或下午 |
| %S | 以小数形式表示的秒 [00,61] |
| %U | 一年中的第几周(以星期日为一周的第一天),以十进制数字表示 [00,53] |
| %w | 作为十进制数字的星期几 [0(星期日),6] |
| %W | 一年中的第几周(以星期一为一周的第一天),十进制数字 [00,53] |
| %x | 日期,格式为 "%m/%d/%Y" |
| %X | 时间,格式为 "%H:%M:%S" |
| %y | 无世纪年份的十进制数 [00,99] |
| %Y | 以十进制数字表示的带世纪的年份 |
| %Z | 时区偏移,例如 "-0700" |
| %% | 一个字面的“%”字符 |
更多信息见:https://github.com/d3/d3-time-format/tree/v4.0.0#locale_format
🌐 More info in: https://github.com/d3/d3-time-format/tree/v4.0.0#locale_format
坐标轴刻度(v10.3.0+)
🌐 Axis ticks (v10.3.0+)
默认的输出刻度是自动的。你可以自定义你的 tickInterval,比如 1day 或 1week。
🌐 The default output ticks are auto. You can custom your tickInterval, like 1day or 1week.
markdown
tickInterval 1day模式是:
🌐 The pattern is:
javascript
/^([1-9][0-9]*)(millisecond|second|minute|hour|day|week|month)$/;更多信息请参见:https://github.com/d3/d3-time#interval_every
🌐 More info in: https://github.com/d3/d3-time#interval_every
基于周的 tickInterval 默认从星期日开始。如果你希望指定 tickInterval 开始的其他工作日,请使用 weekday 选项:
🌐 Week-based tickIntervals start the week on sunday by default. If you wish to specify another weekday on which the tickInterval should start, use the weekday option:
代码:
mermaid
警告
在 v10.3.0 中添加了对 millisecond 和 second 的支持
紧凑模式输出
🌐 Output in compact mode
紧凑模式允许你在同一行显示多个任务。通过在之前的 YAML 设置中设置图表的显示模式,可以为甘特图启用紧凑模式。
🌐 The compact mode allows you to display multiple tasks in the same row. Compact mode can be enabled for a gantt chart by setting the display mode of the graph via preceding YAML settings.
代码:
mermaid
注释
🌐 Comments
可以在甘特图中输入注释,这些注释将被解析器忽略。注释需要单独占一行,并且必须以 %%(双百分号)开头。从注释开始到下一行的任何文本都将被视为注释,包括任何图表语法。
🌐 Comments can be entered within a gantt chart, which will be ignored by the parser. Comments need to be on their own line and must be prefaced with %% (double percent signs). Any text after the start of the comment to the next newline will be treated as a comment, including any diagram syntax.
代码:
mermaid
样式
🌐 Styling
甘特图的样式是通过定义多个 CSS 类来完成的。在渲染过程中,这些类会从位于 src/diagrams/gantt/styles.js 的文件中提取。
🌐 Styling of the Gantt diagram is done by defining a number of CSS classes. During rendering, these classes are extracted from the file located at src/diagrams/gantt/styles.js
使用的类
🌐 Classes used
| 类别 | 描述 |
|---|---|
| grid.tick | 网格线样式 |
| grid.path | 网格边框样式 |
| .taskText | 任务文本样式 |
| .taskTextOutsideRight | 超出活动条右侧的任务文本样式 |
| .taskTextOutsideLeft | 超出活动条左侧的任务文本样式 |
| todayMarker | “今天标记”的切换及样式 |
示例样式表
🌐 Sample stylesheet
css
.grid .tick {
  stroke: lightgrey;
  opacity: 0.3;
  shape-rendering: crispEdges;
}
.grid path {
  stroke-width: 0;
}

#tag {
  color: white;
  background: #fa283d;
  width: 150px;
  position: absolute;
  display: none;
  padding: 3px 6px;
  margin-left: -80px;
  font-size: 11px;
}

#tag:before {
  border: solid transparent;
  content: ' ';
  height: 0;
  left: 50%;
  margin-left: -5px;
  position: absolute;
  width: 0;
  border-width: 10px;
  border-bottom-color: #fa283d;
  top: -20px;
}
.taskText {
  fill: white;
  text-anchor: middle;
}
.taskTextOutsideRight {
  fill: black;
  text-anchor: start;
}
.taskTextOutsideLeft {
  fill: black;
  text-anchor: end;
}
今天标记
🌐 Today marker
你可以为当前日期的标记设置样式或隐藏它。要设置样式,请为 todayMarker 键添加一个值。
🌐 You can style or hide the marker for the current date. To style it, add a value for the todayMarker key.
todayMarker stroke-width:5px,stroke:#0f0,opacity:0.5要隐藏标记,请将 todayMarker 设置为 off。
🌐 To hide the marker, set todayMarker to off.
todayMarker off配置
🌐 Configuration
可以调整甘特图的渲染边距。
🌐 It is possible to adjust the margins for rendering the gantt diagram.
这是通过定义配置对象中的 ganttConfig 部分来完成的。 如何使用 CLI 在 mermaidCLI 页面中有说明。
🌐 This is done by defining the ganttConfig part of the configuration object. How to use the CLI is described in the mermaidCLI page.
mermaid.ganttConfig 可以设置为包含配置参数的 JSON 字符串或相应的对象。
🌐 mermaid.ganttConfig can be set to a JSON string with config parameters or the corresponding object.
javascript
mermaid.ganttConfig = {
  titleTopMargin: 25, // Margin top for the text over the diagram
  barHeight: 20, // The height of the bars in the graph
  barGap: 4, // The margin between the different activities in the gantt diagram
  topPadding: 75, // Margin between title and gantt diagram and between axis and gantt diagram.
  rightPadding: 75, // The space allocated for the section name to the right of the activities
  leftPadding: 75, // The space allocated for the section name to the left of the activities
  gridLineStartPadding: 10, // Vertical starting position of the grid lines
  fontSize: 12, // Font size
  sectionFontSize: 24, // Font size for sections
  numberSectionStyles: 1, // The number of alternating section styles
  axisFormat: '%d/%m', // Date/time format of the axis
  tickInterval: '1week', // Axis ticks
  topAxis: true, // When this flag is set, date labels will be added to the top of the chart
  displayMode: 'compact', // Turns compact mode on
  weekday: 'sunday', // On which day a week-based interval should start
};
可能的配置参数:
🌐 Possible configuration params:
| 参数 | 描述 | 默认值 |
|---|---|---|
| mirrorActor | 开启/关闭图表下方及上方的角色渲染 | false |
| bottomMarginAdj | 调整图表结束的下边距。使用 CSS 的宽边框样式可能会产生不希望的裁剪,这就是此配置参数存在的原因。 | 1 |
互动
🌐 Interaction
可以将点击事件绑定到任务上。点击可以触发 JavaScript 回调,或打开当前浏览器标签页中的链接。注意:在使用 securityLevel='strict' 时该功能被禁用,在使用 securityLevel='loose' 时启用。
🌐 It is possible to bind a click event to a task. The click can lead to either a javascript callback or to a link which will be opened in the current browser tab. Note: This functionality is disabled when using securityLevel='strict' and enabled when using securityLevel='loose'.
click taskId call callback(arguments)
click taskId href URL- taskId 是任务的 ID
- callback 是在显示图表的页面上定义的 JavaScript 函数的名称,如果没有指定其他参数,该函数将以 taskId 作为参数被调用。
初学者提示 - 在 HTML 环境中使用交互式链接的完整示例:
🌐 Beginner's tip—a full example using interactive links in an HTML context:
html
<body>
  <pre class="mermaid">
    gantt
      dateFormat  YYYY-MM-DD

      section Clickable
      Visit mermaidjs         :active, cl1, 2014-01-07, 3d
      Print arguments         :cl2, after cl1, 3d
      Print task              :cl3, after cl2, 3d

      click cl1 href "https://mermaidjs.github.io/"
      click cl2 call printArguments("test1", "test2", test3)
      click cl3 call printTask()
  </pre>

  <script>
    const printArguments = function (arg1, arg2, arg3) {
      alert('printArguments called with arguments: ' + arg1 + ', ' + arg2 + ', ' + arg3);
    };
    const printTask = function (taskId) {
      alert('taskId: ' + taskId);
    };
    const config = {
      startOnLoad: true,
      securityLevel: 'loose',
    };
    mermaid.initialize(config);
  </script>
</body>
示例
🌐 Examples
柱状图(使用甘特图)
🌐 Bar chart (using gantt chart)
代码:
mermaid
时间线(带注释、CSS、前置配置)
🌐 Timeline (with comments, CSS, config in frontmatter)
代码:
mermaid